Hypsometric maps represent the elevation of the terrain with colours. The area between two neighbouring contour lines receives one specific tint.
Hypsometric colours are most common in topographic maps at small scales, either applied as continuous gradients or intervals. The succession of colours occurs according to different rules.
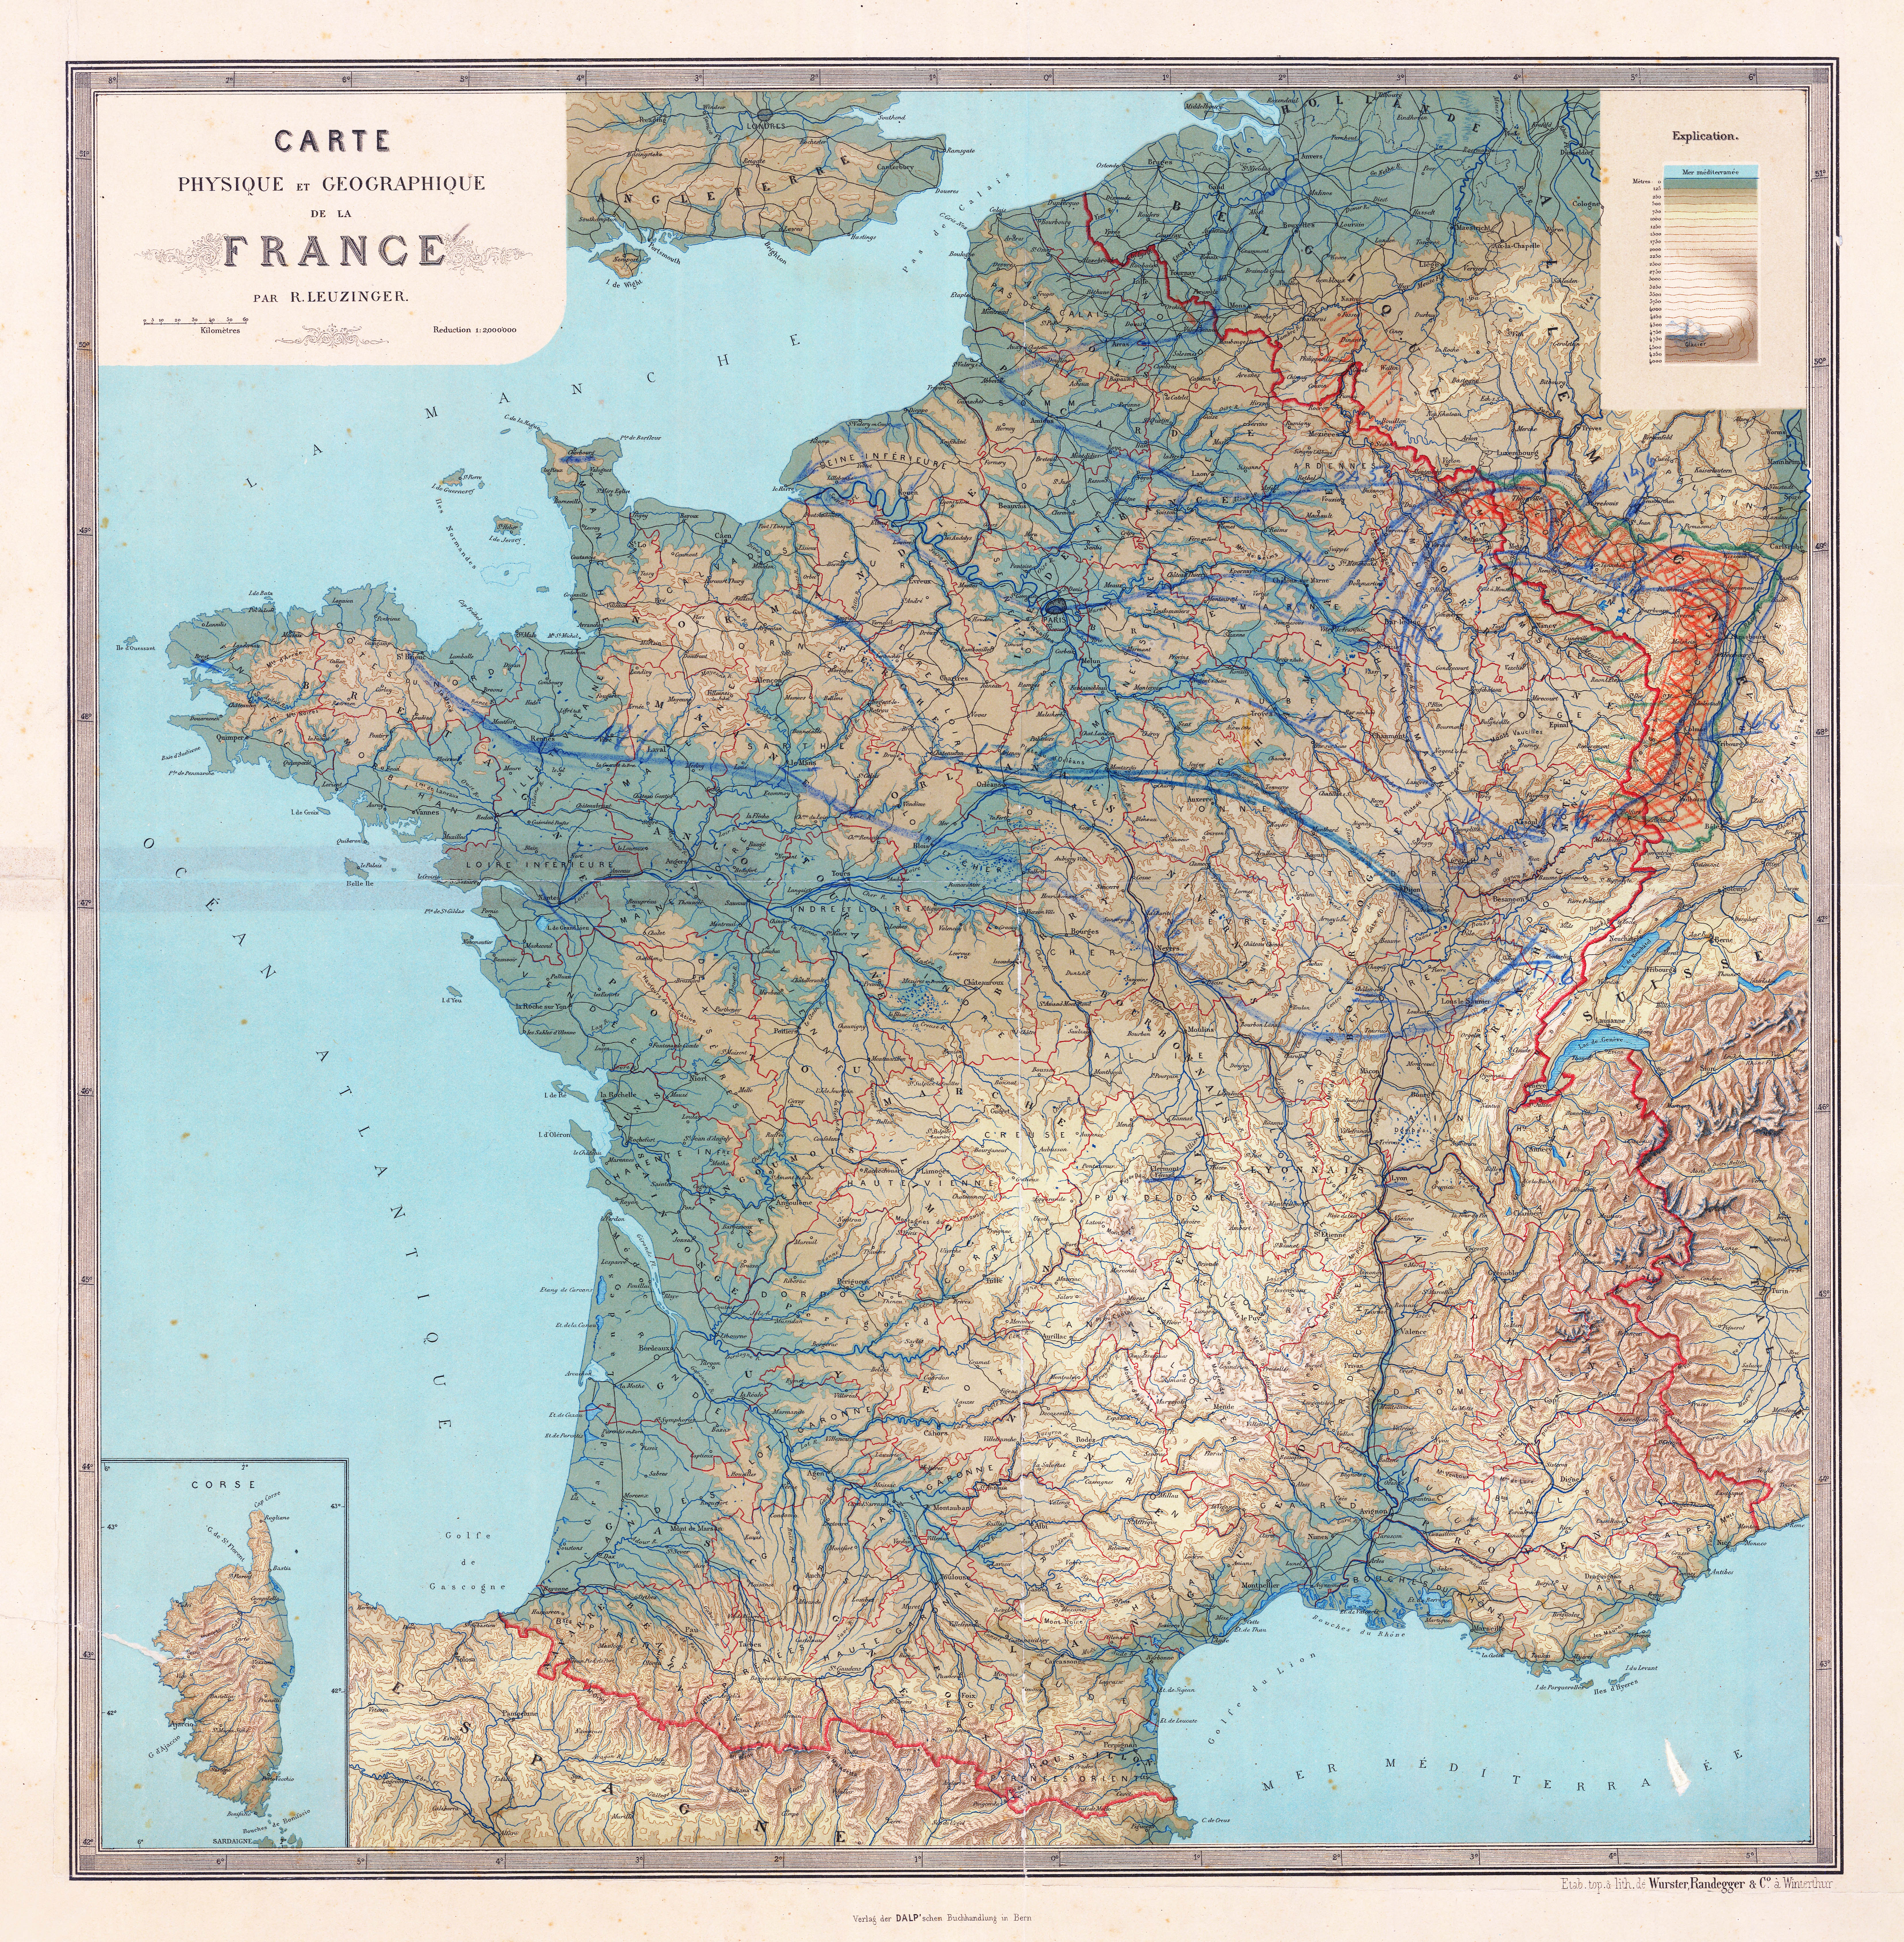
“Carte physique et géographique de la France” by Rudolf Leuzinger, 1:2 million, 1880. Click on the map for an high-resolution version (9.7 MB).
The cartographer has to choose the number of different colour classes, their limiting contour lines and the colours.
Generally, relatively light colours are preferable and the basic principle “higher is brighter” is advice worth heeding. Nevertheless, good alternative colour schemes exist that employ different rules.
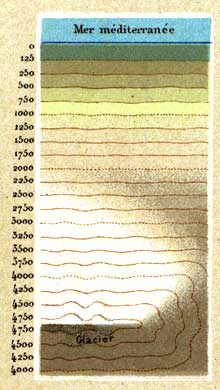
Hypsometric classification and colours used by Rudolf Leuzinger for his “Carte physique et géographique de la France”.
Digital elevation models make it easy for cartographers to automatically generate hypsometrically coloured maps. Different software packages allow for the selection of an arbitrary number of classes and colours.
In the following example, elevation is well accentuated by hypsometric colours. However, the colours do not consider the dry vegetation of Egypt. See “Natural colours” for an example of the same area with colours closer to nature.
“Delta du Nil et Can. de Suez” (section). Special print without text. Relief by Hermann Leubner from © Schweizer Weltatlas, p. 100, 1981.